31 January 2017

Mark Trumbo Projections: Take the Under

Dan Duquette has a knack for finding value on the fringes of active rosters.  He found himself Nate McLouth, David Lough, Nelson Cruz, and Mark Trumbo.  He has had some misses too like Travis Snider, reupping Alejandro De Aza, and strangely trading starting pitching depth for Gerardo Parra.  However, he generally does well with his recycling bin selections.  One major benefit, of course, is that this enables him to bet on breakout candidates while only locking himself in to a one year deal.  A one year deal reduces the upside of a deal, but also greatly controls for any losses.  For a club like the Orioles, a heavy spending lower revenue club, it is difficult to get a payroll locked into big deals (more on this in three years when I talk about Chris Davis).

A few weeks back, one year mild breakout Mark Trumbo officially re-upped with the Orioles for three years at 37.5 MM.  It was about half of his initial total asking price and a year shorter.  The Orioles effectively gave up a compensation round pick (Trumbo was a QO player likely to sign eventually), so the price tag was more around 43 MM overall.  As the market has gone this past offseason, it was a good, but not great deal.  Two of the closer comps price-wise to Trumbo would be Kendrys Morales (3/33) and Josh Reddick (4/52).

Age
xAVG
xOBP
xSLG
xrRC+
Mark Trumbo 31 .251 .307 .491 110
Kendrys Morales 34 .266 .331 .469 112
Josh Reddick 30 .268 .335 .453 113

A few things jump out.  One, as much press as the Blue Jays have gotten about Kendrys Morales, the only real knock against him is his age.  His projected performance over his age 34 to 36 seasons does not vary far from where Trumbo and Reddick would be except that he likely has a far higher chance of collapse.  Reddick's deal looked reasonable at the time, but looks rather solid right now.  He can play both corners and puts up a value similar to Trumbo, but with more of an emphasis on drawing walks.  If we accept that Trumbo's 3/37.5 contract was really a 3/43 deal with the draft pick loss, then Reddick at 4/52 looks like a far more desirable player.  Anyway, Trumbo is the one the club signed.  At a .337 wOBA, slightly above league average, it is not a very remarkable line, but one that would benefit most any batting order. 

I do wonder, however, whether that line may not be reflecting the reality of Trumbo's playing time context.  In other words, I question whether the projection model's failure to account for how well Trumbo hits as a designated hitter vs. how well he hits as a right fielder.  Three years ago, MGL studied the impact of being a designated hitter had on hitting and found that there was a designated hitter penalty of .014 wOBA, which would be pretty significant for a player like Mark Trumbo.

Right now, it appears that he will face right handed pitching as a designated hitter and left handed pitching as an outfielder.  It is somewhat generic to break it down this way, but let's say that break is about 400 PA at DH and 200 PA at RF.  Let's also be a bit more generic and just assume all 400 of those DH PA are against RHP and all 200 of those PA in RF are against LHP.  Try to let that go as this is simply a napkin scratch of an effort.

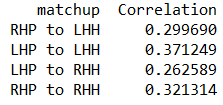
Now, it is accepted that batting is hand dependent on the pitcher.  Trumbo is not much of a platoon hitter, but seems to have a little favorability against left handers (2016 being an outlier).  But it is largely even (.335 wOBA vs LHP, .331 wOBA vs RHP career).  Less known is that hitting appears to also be impacted by whether a player is in the field.  Like handedness, not all players are affected by this, but some appear to be.  For instance, Trumbo appears to be affected by whether or not he is out in the field with a 2015/2016 wOBA of .365 in the field and .310 at DH.

Player position appears that it will impact Trumbo far greater than the typical player assumed to be impacted in MGL's analysis.  This might raise an eyebrow, but is not necessarily surprising.  Individuals might vary greatly in how well they are able to stay focused on a task.  In the greater world, people may need constant task processing to be able to quickly focus and assume a new task.  On the other hand, people without constant tasks may lose concentration and have difficulty regaining it.  We see some elements of this in attention deficit disorders and other focus issues.  It is why some doctors suggest to patients with poor daily focus to keep crosswords or other word puzzles around to keep the mind engaged between tasks.  That said, this is not exactly a firm, consensus opinion.

So, let's apply handedness and positional effects to Trumbo's line.  Applying handedness to the projections, we get:

RHP 251/310/483, .232 ISO and .335 wOBA
LHP 251/302/506, .255 ISO and .340 wOBA

Next, we apply position:

DH and RHP 216/272/419, .192 ISO and .281 wOBA
RF and LHP 286/339/570, .296 ISO and .396 wOBA

Overall 239/294/470, .227 ISO and .319 wOBA

At that point, things look pretty terrible.  Perhaps, the DH specific numbers are an anomaly and will even up over time.  That said those numbers have about 400 PA, which has some meaning attached to it.  It probably won't happen, but it might be best for the team to consider whether the best alignment is with Trumbo at first base and Chris Davis in the designated hitter role.  During his time with the Orioles, Davis really only served as a designated hitter during the 2015 season and his production dropped 13% in comparison to when he was playing first base.  That might be a real effect or it might be simply that Davis was the DH when he needed a blow.

Perhaps a cause for optimism was a study published by the Hardball Times in 2015.  It found that it takes about 50 PA for a pinch hitter to lose their pinch hitting penalty, which is similar to a designated hitter penalty.  Maybe being a designated hitter requires adjustment just like being able to perform at a new position.  So how did Trumbo do as a designated hitter last year as the season progressed in thirds?

Thirds
1st
2nd
3rd
RF .899 .836 .924
DH .908 .731 .712
Penalty .009 -.105 -.212

Well, that is interesting.  And, well, potentially alarming.  It appears that perhaps the Orioles should look to get Trumbo into the field as much as possible.

30 January 2017

The Case Against Bringing Back Matt Wieters

The Orioles' signing of Welington Castillo signaled that they had moved on from Matt Wieters and were all settled at catcher. But Wieters is still a free agent, and some have speculated about his possible return to Baltimore. Until Wieters actually signs, that will keep being a thing. And while extremely unlikely, it's not impossible.

A few days ago, Dan Connolly of BaltimoreBaseball.com discussed the possibility of the Orioles re-signing Wieters to "a one-year, pillow deal" to split work behind the plate with Castillo.

Here's more from Connolly:
And where do offensive players often end up when a one-year agreement is the best option? Camden Yards, of course.

In a sense, Baltimore suddenly becomes the perfect fit for Wieters in that one-year scenario. Their competitive clock is ticking, and their hope is they don’t need a long-term catcher.

Wieters, a switch-hitter, and Castillo, a right-handed hitter, could rotate at catcher and DH some, keeping both fresh and making Buck Showalter’s bench stronger. It would push Caleb Joseph to the minors, and though that would be unfortunate for Joseph, it wouldn’t be a terrible thing for the organization.
Who knows what exactly it would take to re-sign Wieters, or if he'd be willing to give the Orioles some type of "home-town discount" since there don't appear to be many teams out there extending enticing offers. And the Joseph-grooming-Chance Sisco angle sounds great -- Joseph is surely a professional -- but the Orioles also have coaches and Joseph is not without any value at the major league level.

Let's focus on the Castillo/Wieters potential fit. Castillo and Wieters are both healthy, so they're expecting to catch more than 100 games each next season. With a 2018 player option, Castillo is already on his own pillow contract of sorts. In this scenario, both players will want as much playing time as possible for the chance to excel and land a longer, more lucrative deal. That sounds like a pretty awkward situation; it's unlikely Castillo would have signed his deal if Wieters were still under consideration.

But, hey, having both catchers split the work seems like a decent idea, right? And as Connolly noted, Castillo is right-handed, and Wieters is a switch-hitter. Who doesn't love yet another platoon? Unfortunately, despite being able to hit from both sides of the plate, Wieters has been much better against lefties in his career:

Wieters career vs. RHP: 91 wRC+
Wieters career vs. LHP: 114 wRC+

Castillo has also found much more success against lefties:

Castillo career vs. RHP: 88 wRC+
Castillo career vs. LHP: 126 wRC+

That's not how you construct an effective platoon.

Since both players have hit lefties well, perhaps that could be a benefit when facing left-handed starters. Wieters or Castillo would start, and the other could DH. But that also has a few ramifications. First, it would push Mark Trumbo to right field. That's never a good thing, though that might happen anyway. Second, it almost certainly pushes Trey Mancini to the minors. That's not the worst thing, as it will already be difficult for Buck Showalter to find playing time for a first baseman/DH on a roster that has Chris Davis and Trumbo. But Mancini, while still a question mark, does provide a cost-effective bench bat, and he has shown the tendency to hit left-handers better in the minors. And third, while it's a much lesser concern, how often do you want your backup catcher in the DH spot in case something happens to the starter? Showalter hasn't opted to use Wieters much as a DH, choosing to give him more rest. Maybe that would change with another catching option.

Regardless, guys like Castillo and Wieters are valuable because they have the ability to hit while playing such a demanding position. You could work in some DH at-bats here and there, but it doesn't add much to their value. But it probably wouldn't be particularly helpful to have two catchers with pitch-framing abilities that are much in question.

If the Orioles have money available to bring Wieters back for a year, then it would probably be better spent on adding some starting pitching or outfield depth. (Right, Adam Jones?) Sure, there's comfort in familiarity, and the Orioles have demonstrated in the Showalter era that they do value clubhouse chemistry and fit. As someone who's been with the Orioles through the highs and lows, Wieters checks those boxes. But you also have to know when to say goodbye.

The O's have capable, cheap, and better-framing backup options in Joseph and Francisco Pena, and there's no reason to add Wieters back for anything less than a complete and total bargain (and how likely is that for a Scott Boras client?). If he does end up settling for a one-year deal, Wieters will likely be more interested in a situation where he can get the bulk of the innings behind the plate. That place, for the time being, isn't Baltimore.

27 January 2017

The Orioles Already Have A Capable Leadoff Option (Or Platoon)

In 2016, Orioles leadoff hitters had a combined wRC+ of 94. That was fourth worst in the American League. O's hitters in the second lineup slot, meanwhile, had a wRC+ of 121. That was good enough for third best.

The majority of leadoff plate appearances went to Adam Jones (488) and Joey Rickard (183). Jones is not a leadoff hitter, but did a competent job there last season (108 wRC+) while not reaching base at a high clip (.320 OBP). Most of the plate appearances in the No. 2 lineup spot went to Hyun Soo Kim (259), Manny Machado (164), and Jonathan Schoop (125). Machado and Kim were two of the O's best hitters last season, so it's not surprising then that the results from that spot in the order would be better than those of the leadoff spot.

It's well-worn territory by now where certain types of hitters should go in a team's lineup (and also that, by and large, the lineup order isn't that important - but it still matters somewhat and is easy/fun to discuss). There's plenty to read on efficient lineup ordering, and I summarized the Orioles' situation last season while arguing that Machado should bat second, not third. Machado should certainly bat second the majority of the time in 2017, while Jones should be placed lower in the order.

The first part of who should bat leadoff, then, is at least clear. Kim should bat first against right-handed pitching. In his first major league season, Kim was nearly 30% better than league average against opposite-handed throwers. Of all batters with at least 300 plate appearances, his .382 on-base percentage was 18th best in the majors. Against right-handers only, his .393 OBP was tied for ninth best overall (minimum 250 plate appearances).

For the Orioles, it's been a while since they had someone with Kim's on-base skills. In the Expansion Era, the longest the Orioles had gone from 1961 to 2008 without a hitter with an on-base percentage of at least .380 was three years. The Orioles went eight years, however, between Markakis's .406 OBP in 2008 and Kim's .382 OBP last season. The Orioles need to do whatever it takes to utilize Kim's skills at reaching base while they have him.

There's a decent argument that Kim should play every game and bat first, despite his struggles in limited duty against left-handed pitchers. I'd have no issue with that. Another option, though, would be to deploy a leadoff platoon: Kim vs. right-handers and Rickard vs. left-handers. I'm far from the only person to believe that platoon would make sense, even if you don't think that Kim (129 wRC+ in 323 PA) and Rickard (131 wRC+ in 90 PA) will be able to replicate their strong showing against opposite-handed throwers going forward.

But, so what? What are the alternatives? It's not Jones and his career 107 wRC+. Seth Smith is similar to Kim as a more proven left-handed platoon bat, so he might work. Kim on-base skills seem superior, however, so Smith could be a nice fit in the middle of the lineup, since Buck Showalter relishes alternating right- and left-handed batters (or at least trying to).

There's no option that sounds more enticing than either batting Kim leadoff full-time (less likely) or using the Kim/Rickard platoon (more likely). Showalter already learned his lesson last season when he benched Kim for most of April. It's time to give him a shot from day one in 2017 and see what he can do.

Stats via FanGraphs, Baseball-Reference, and the Play Index

26 January 2017

A Quick Glimpse At Exit Velocity

Baseball statistics have gotten increasingly complicated over time. Once upon a time, people primarily used counting stats like RBIs, home runs and stolen bases. Some of the most complicated statistics were stats like batting average, fielding percentage and ERA basically requiring little more math than average division. Then, there were statistics like FIP, wOBA and WAR. These are difficult to calculate, but are reasonably simple to understand. A higher wOBA and WAR is better than a lower one. Now, with data from Statcast and Pitch Fx available to the public, it allows us the creation of new statistics that are difficult to both calculate and understand. One of these metrics is exit velocity.

Exit velocity is a relatively new stat that I believe was introduced with the creation of Statcast. It measures how the speed of a baseball after it is hit by a batter. According to Sports Illustrated, the Rays solely use exit velocity to measure batter performance. It’s also popular with players. Jake Lamb has said that he thinks that exit velocity tells you exactly what you need to know and that he likes this stat even though he generally doesn’t care for stats. It probably didn’t hurt that this stat ranked him highly.

However, it can be difficult to understand. Take ERA for example. There’s no special bonus for giving up a low amount of runs just like there’s no special penalty for giving up a large amount of runs. Each run allowed per nine runs increases a pitchers ERA by a run. Each double hit increases a batters OPS the same as every other double. In a word, these statistics are linear. You put all the numbers into a formula and it spits out an answer that values each result similarly.

It isn’t clear that this would necessarily be the case for exit velocity. If one hits a pitch lightly, then it means that a fielder may have to charge the grounder and make a throw to first while running to get the out. Depending the game situation, the fielder’s ability or the runners speed, a fielder may decide not to make the throw. If he does make the throw, there’s the possibility that the runner will beat the throw or that it will result in an error. In contrast, a grounder hit at a normal speed will likely be easily fielded with enough to throw for first for the out. When hit into the air, it will likely result in a routine fly ball. If exit velocity isn’t linear, then it means that we’ll need to come up with different ways to understand it.

My hypothesis is that graphing exit velocity by wOBA would result in a parabolic shape. Balls with high exit velocity would have the highest average wOBA. Those with the lowest exit velocity would have a medium wOBA, and those with average velocity would have the lowest wOBA. In order to test my hypothesis, I downloaded a summary table created by Baseball Savant that has exit velocity and wOBA and graphed my results. It turns out that I was somewhat right and wrong.

The chart below shows the average wOBA by exit velocity as measured in miles per hour. The graph isn’t a parabola per se, but there’s definitely some similarity. Batters do extremely well when they hit the ball over 100 mph. From 91-99 mph, their performance begins to decrease significantly. In the sample measured by the summary table, batters had a .542 wOBA when they had an exit velocity of 99 mph and a wOBA of .257 when they had an exit velocity of 91 mph. Batter wOBA continues to drop based on exit velocity until batters hit the ball at 35 mph. Once exit velocity drops to 35 mph, wOBA increases with it to the .350 mark. It seems that hitting the ball very lightly may be better than hitting the ball 90 mph. Here’s the chart.


This next chart shows average wOBA based on exit velocity as measured in groups of either 5 or 10 mph (only for 50-59 and 60-69 mph). This chart is probably a bit clearer to understand than the first one and clearly shows how a small increase in velocity leads to a large increase in production only if the ball is hit with an exit velocity of over 95 mph. It does seem to show that batters have a small bump in performance if they hit the ball between 60-74 mph, but this could just be a quirk of the data that wouldn’t show up if we used a different sample.


These charts show why exit velocity is different than other more standard stats. There’s a huge bonus for hitting the ball really hard. But if you hit the ball at an average speed, then it doesn’t really matter much if you hit the ball 60 or 70 mph. Your results will likely be substandard. There is also evidence that suggests that an exit velocity of 20-34 mph will result in better results than hitting the ball at 60 mph. To be fair, there were only 119 balls put into play between 20-34 mph and Statcast has difficulty measuring pitches hit that weakly. This may just be the result of an error in the data and may not actually exist in real life.

This is why there’s only a .561 correlation between exit velocity and wOBA when looking at all balls put into play measured by Statcast by all batters. It’s true that a hard hit ball is better in general than a softly hit ball, but that doesn’t make it true in all instances. As such, this is one reason why average exit velocity has limited value.

Instead of looking at average exit velocity, it is therefore important to look at exit velocity in bins. Pitches hit with an exit velocity of 105+ mph should be considered highly valuable. Pitches hit with an exit velocity between 100 and 105 should also be considered successful at bats. Pitches hit between 95-99 mph are not as valuable but still likely to be somewhat productive. Anything lower than 95 mph should probably be ranked as needing improvement.

Potentially, this may mean that a batter with an average exit velocity of 85 mph can be less valuable than a batter with an average exit velocity of 75 mph. If the batter with an average exit velocity of 85 generally puts the ball into play with an exit velocity between 80 and 90 mph, then he’s not going to be productive. However, a batter with an average exit velocity of 75 mph but puts a lot of pitches into play with an average exit velocity of over 100 mph or under 40 mph could be extremely useful. Especially if he’s a quick runner and can beat out a tough throw to first. In addition, it’s possible that an acceptable exit velocity depends on the type of pitch thrown.

Some of the new statistics available to the public are excellent and can help advance our understanding of baseball but don’t necessarily work like statistics have in the past. As a result, we’ll have to use different methodologies to gauge their value and what they’re telling us about baseball players.

25 January 2017

Pitchers with the Most Effective Curveballs

I sought to generate a new means of pitch evaluation that uses exit velocity, as new research by some of the smartest people around baseball suggests that exit velocity (along with launch angle) is one of the best indicators of whether a batted ball will become a hit.

To generate this new means of measuring pitch effectiveness, I first broke the data into matchup types according to pitcher and batter handedness. Within each matchup type, I found each batter's average exit velocity against curveballs. Then, I compared the exit velocities of unique pitch events to the batter involved in the event's average exit velocity. Finally, I averaged the difference between observed and average exit velocities for each pitcher. This generates a record of each pitcher's average suppression or amplification of a batter's overall ability to hit curveballs hard.

Because this method of pitch evaluation is based on individual batters' average exit velocity, it implicitly accounts for the primary driver of exit velocity: bat speed. Additionally, because the data is split along handedness matchups, it accounts for platoon advantages.

In 2016 data, there is a direct correlation between a pitcher's mean difference between the exit velocities on curveballs he surrenders and a batter's average exit velocity on curveballs and the measured exit velocity of a unique curveball for each combination of pitcher and batter handedness. The data shows exactly what is expected: pitchers whose curveballs are, on average, hit harder than other pitchers' tend to see a higher exit velocity on specific curveballs. Put another way, if a pitcher's curveballs are all bad, it's more likely that a specific curveball he threw is bad.

The correlation between average exit velocity suppression and observed exit velocity is noticeably stronger in matchups between pitchers and batters of the same handedness:
Right handed pitchers with bad curveballs get hit even harder by right-handed batters than left-handed batters, but good curveballs against same-handed batters suppress exit velocities more than they do against opposite-handed batters.

Records for Orioles pitchers, shown below as white-outlined, non-transparent points, show only Dylan Bundy displaying an ability to suppress a batter's average curveball exit velocity, and he effectively suppresses exit velocity against both right-handed hitters and left-handed hitters. Other Orioles pitchers tend to throw curveballs hit roughly 5 miles per hour harder than the batter they're facing hits curveballs.

Yovani Gallardo, recently shipped to Seattle, threw a curveball that was hit over 3 miles per hour harder by righties and 6 miles per hour harder by lefties. Dylan Bundy and Tyler Wilson throw curveballs with an apparent ability to suppress the exit velocities of left-handed hitters.
That Dylan Bundy shows up here as having a pretty good curveball is supported by Brooks Baseball's general assessment of his pitch:
His curve is a real worm killer that generates an extreme number of groundballs compared to other pitchers' curves and has a sharp downward bite.
Per Fangraphs, Bundy's curveball was his most valuable pitch in 2016, with the pitch worth about 1.1 runs above average in 2016. Bundy's fastball, by comparison, was worth -4.7 runs below average. While the above analysis does not take game scenario into account, Fangraphs' pitch values do, but incorporating run expectancy based on count.

That this method of measuring pitch effectiveness is in agreement with longer-standing methods suggests that using a pitcher's mean exit velocity suppression on any pitch type can in fact give an estimation of quality of the pitch. However, this method does not take into account a pitcher's ability to induce swinging strikes, ability to throw curveballs with consistent command, game situation, or pitch sequencing. There is certainly a long way to go - for most pitch value or effectiveness measures - to incorporate all aspects of the game that affect a single pitch in a single at bat.

The top ten right-handed pitchers (minimum 5 records) by ability to suppress right-handed batters' exit velocity against curveballs are:
The top ten right-handed pitchers (minimum 5 records) by ability to suppress left-handed batters' exit velocity against curveballs are:

***
Pitcher Mean Difference from Batter Mean Exit Velocity by matchup:

Thanks to Camden Depot owner Jon Shepard for his contributions to defining the problem addressed in this article.

24 January 2017

Adam Brett Walker: Chris Carter in the Rough

Around Baltimore, some of the more attentive and hopeful fans latched onto Adam Brett Walker as a diamond in the rough who could provide a performance similar to Chris Carter before he was designated for assignment upon Mark Trumbo's return.  Carter and Walker are mashers, but that similarity ignores potentially drastic ways in which these Walker differs from the others.  Those differences present unique challenges to Walker and a great amount of doubt in the industry as to whether he can overcome those challenges.  This doubt is well expressed in his transaction wire travels this past fall.

In December, the Orioles claimed Adam Brett Walker off the Milwaukee Brewers, a club that he had only been with for about two months.  The Brewers had claimed him off the Minnesota Twins.  Both of those clubs are bottom third clubs short on talent and great on opportunity.  When Milwaukee claimed Walker, they needed the Reds, Padres, Rays, Braves, Athletics, Diamondbacks, and Phillies to pass on him.  They did.  When the Brewers DFA'd him, the Orioles needed those seven clubs plus the Twins, Angels, Rockies, White Sox, Pirates, Marlins, Royals, Astros, Yankees, Mariners, Cardinals, Tigers, Giants, and Mets to pass on him.  They did and Walker graced the Orioles organization until his presence was put in DFA limbo as mentioned earlier.

Now, Adam Brett Walker is one of the best baseball players in the world.  He also has some of the greatest power of any batter in the world.  The main problem though is that Walker is quite likely unable to do much against the very best pitchers in the world.  There is a reason why Walker played last year at AAA and is on a 40 man roster.  He is quite good at baseball.  Indeed, Walker might be the 1,000 best baseball player in the world out of 5 or so billion, but that probably does not mean much for the Orioles.

However, he may not be the right kind of player to enjoy success in the majors.  Nor does he have the prospect cache or skill set that would provide him with ample opportunity at the major league level to prove doubters wrong.  Walker will likely need a venue to better showcase his skills and that might entail a trip abroad. If he took his bat to the KBO, our KANG model projects Adam Brett Walker as a 281/372/509 hitter with 47 home runs.  That might well turn someone's head and earn him a deal similar to the 3/15 deal Thames signed this past December.  It is a kind of performance that could earn Walker a few million a year as opposed to money he currently is seeing in Norfolk.

Anyway, I am ahead of myself.  Yes, this past offseason he has been compared to Chris Carter, a player who has been on the edge of a MLB roster for years.  Both are big guys and can hit the ball a mile. 

Below are Walker's numbers as a professional:

YearAgeAgeDifLevPAHRBBSOBAOBPSLG
201220-0.2Rk252141976.250.310.496
201321-0.3A5522731115.278.319.526
201422-0.7A+5542544156.246.307.436
201523-1.0AA5603151195.239.309.498
2015230.8Fal865835.240.326.493
201624-2.5AAA5312744202.243.305.479
Minors (5 seasons)Minors2449124189744.251.310.486
Provided by Baseball-Reference.com: View Original Table
Generated 1/17/2017.

Here are Carter's numbers through age 24 (with his MLB lines deleted):

Year Age AgeDif Lev PA HR BB SO BA OBP SLG
2005 18 -2.4 Rk 262 10 17 64 .283 .350 .485
2006 19 -2.0 Rk-A 346 16 39 87 .273 .373 .522
2007 20 -1.8 A 545 25 67 112 .291 .383 .522
2008 21 -1.6 A+ 596 39 77 156 .259 .361 .569
2009 22 -2.3 AA-AAA 651 28 85 133 .329 .422 .570
2010 23 -4.0 AAA 551 31 73 138 .258 .365 .529
2011 24 -2.7 AAA-A+ 372 21 46 93 .278 .371 .544
Provided by Baseball-Reference.com: View Original Table
Generated 1/17/2017.

Both show substantial power, but there are a couple differences here that illustrate Carter as perhaps a better hitter.  For one, Carter's batting average ranged from .259 to .329 while Walker's ranged from .239 to .278.  Upper minors saw Walker in the low .240s while Carter was in the .280s.  That shows a rather significant difference in performance as it relates to meaningful contact.  Some SABR hobbyists still claim that batting average is meaningless, but it in fact can communicate quite a bit.  An MLB hitter should be able to maintain a respectable average in the minors.

The second bit of concern are the walk and strikeout differences between the two.  Carter certainly had his troubles coming up through the minors with more advanced pitchers.  He still shows trouble with making contact at the MLB level.  That said, it does not compare to what Walker has gone through.  I am at a complete loss as to who is successful in the majors while striking out 38% of the time in AAA.  Carter struck out at AAA less than 25% of the time.

Anyway, a major difference between Walker and Carter are strikeouts.  Walker's look incredibly high, so it might be good to see how his performance differs from others.  Here is a list of all players in the International League with over 350 PA and who struck out more than 30% of the time:
(min 350 PA)
Year
K%
Adam B Walker 2016 38.0%
Jon Van Every 2008 35.5%
Jason Martinson 2016 35.3%
Jason Martinson 2015 33.8%
Brandon Hicks 2011 33.7%
Jorge Vazquez 2011 33.2%
Mike Hessman 2006 32.7%
Wilson Betemit 2014 31.8%
Clete Thomas 2011 31.7%
Chris Dickerson 2007 31.5%
Vai Pascucci 2012 31.2%
Mike Hessman 2009 31.2%
JP Arencibia 2015 30.9%
Brent Dlugach 2010 30.8%
Ryan Strieby 2011 30.7%
Brent Clevlen 2008 30.7%
Brad Eldred 2008 30.7%
Mike Hessman 2007 30.7%
Matt Davidson 2014 30.4%
Justin Maxwell 2009 30.4%
Steven Moya 2015 30.3%
Coery Brown 2013 30.1%
Jordan Danks 2010 30.1%

That is a very sobering list of players.  A couple weekends ago, I tried to make Oriole specific comps for Walker.  They were: Jack Cust without the walks, Calvin Pickering without the contact, Brandon Waring without the position, Brandon Fahey with power.  Something like that.  Walker has a skillset that looks very challenging to succeed.  Looking at this one part of his performance, the above list shows not a single player who was much of a solution at the MLB level.

When I feel this certain about a performance-based scouting endeavor, I will seek out scouts in the field who I know who will soundboard these quantitative notions.  Both I talked to said I was on the ball with my analysis.  One told me that that the only reason why he stays on public top 20 organization lists is because he hits home runs off poor pitchers and is on someone's 40 man roster.  He noted that several organizations would want him in their system, but maybe a couple think he is worth bothering with if it costs a 40 man slot.  He thinks there is a bit of an echo chamber on Walker because Baseball America has been a tad aggressive on him, which makes him appear as more of a prospect in the public sphere than within the actual industry.

The second guy I talked to called him a 30 player (organizational filler) whose power will probably earn him a couple cups of coffee.  He said there are simply too many holes in the zone for him and advanced AAA arms with some knowledge of him could work the zone and avoid any contact.  On the Orioles, he thought it would be difficult for Walker to ever get a shot, but he could see a bottom rung club with little talent giving him 300-400 at bats.  He thought Walker could hit up to 20 home runs, but would have a very weak batting average.  He thought the profile plays nowhere.

Dan Szymborski was kind enough to give me a sneak peek at Walker's ZIPS projection.  He slashed 222/277/449 with 29 home runs.  It also projected him with 37 walks and 237 strikeouts.  If Walker is truly a below average defender, as suggested in scouting reports, then he would be a negative WAR player.  Similar comps include former Orioles Ken Gerhart and John Russell along with Hensley Muelens and Billy Beane.  The projection is a more favorable view than what I heard from the scouts, but this still falls short of Chris Carter territory.

That all said, Walker is a very good baseball player.  With his skillset, it is difficult to see where exactly he would fit into the Orioles active roster while earning regular playing time.  His low contact, high power minor league performance might play in the majors, but it really is quite a unique collection of skill levels.  If he could manage a bad year Chris Davis at the plate while manning a corner outfield position, then that works.  A .240, 35 home run bat can work out there.  However, we should remember that Chris Davis carries a .337 batting average in AAA.  Walker simply presents an extreme skill set that we have not seen recently in the upper minors and with which players like Mike Hessman could not really make it work.

Personally, my advice for Adam Brett Walker would be to find a way to the KBO as soon as possible.  Maybe he has to spend a year in Norfolk in which Harbor Park will not show off his skillset.  In the KBO though, he would be able to earn about ten times or more what he makes being on the 40 man roster in the minors.  With more cash in the bank, he can eat better, train better, live better.  Walker would have the opportunity to play in front of more energetic crowds than AAA sees.  He will also be able to come back to the States after dominating the KBO and find himself a solid contract in an organization where he wants to be.

Or, maybe, this is the year he forces everyone to recognize that he has MLB talent.